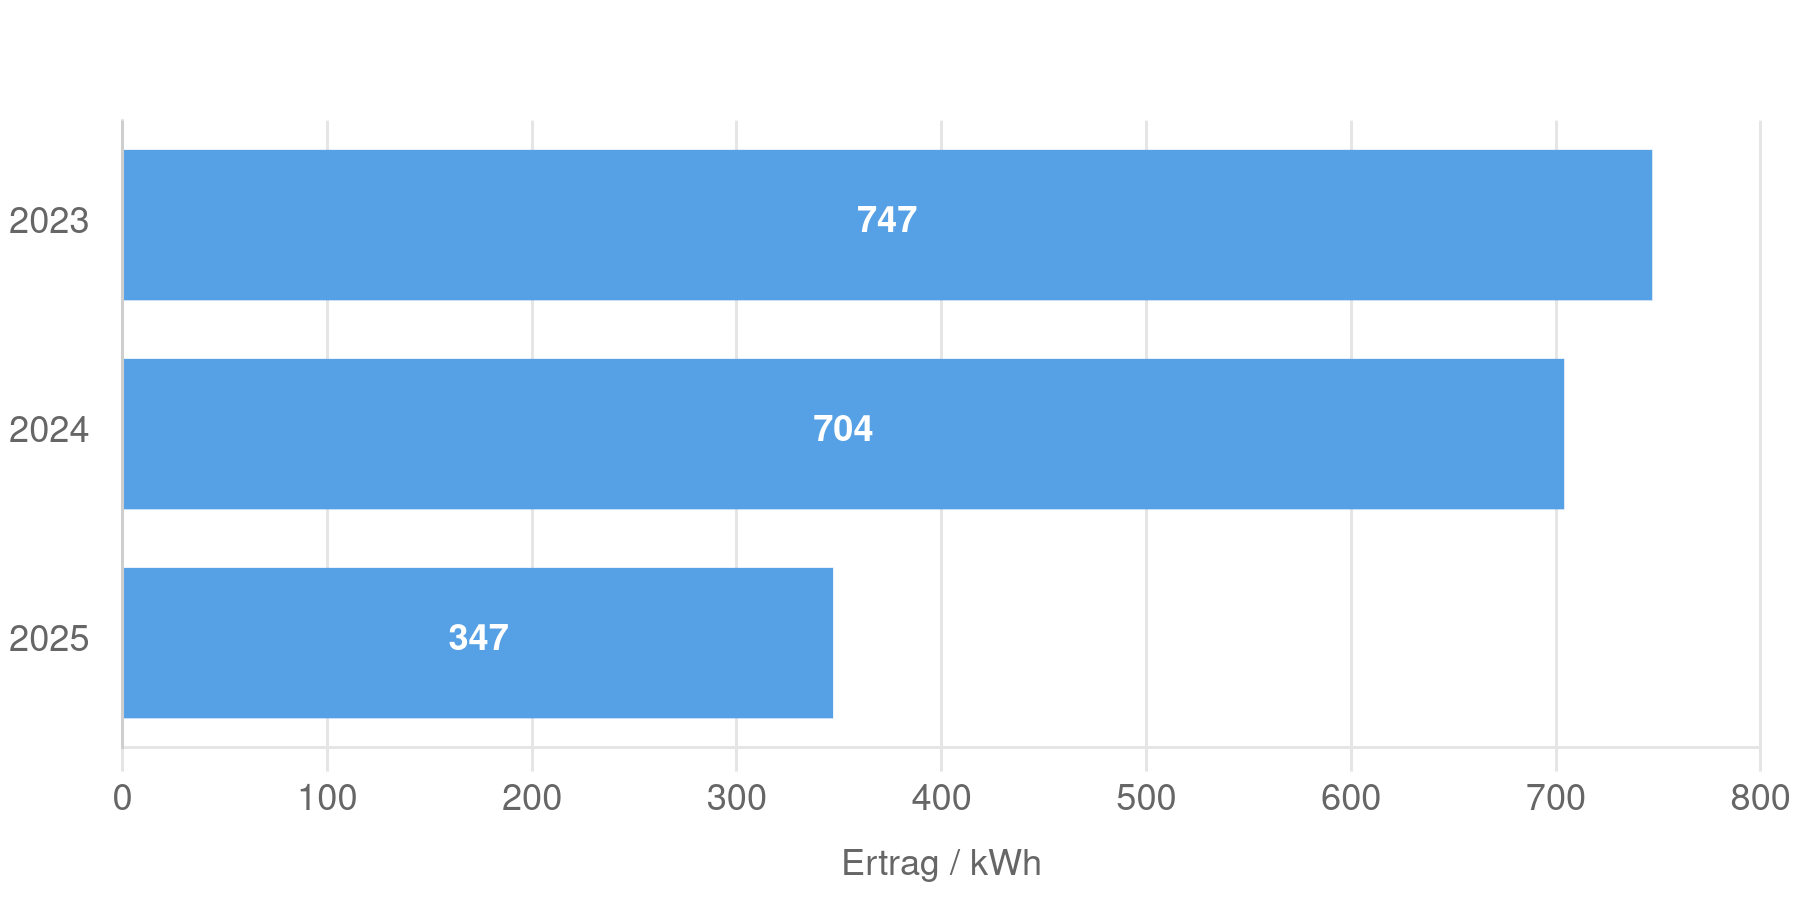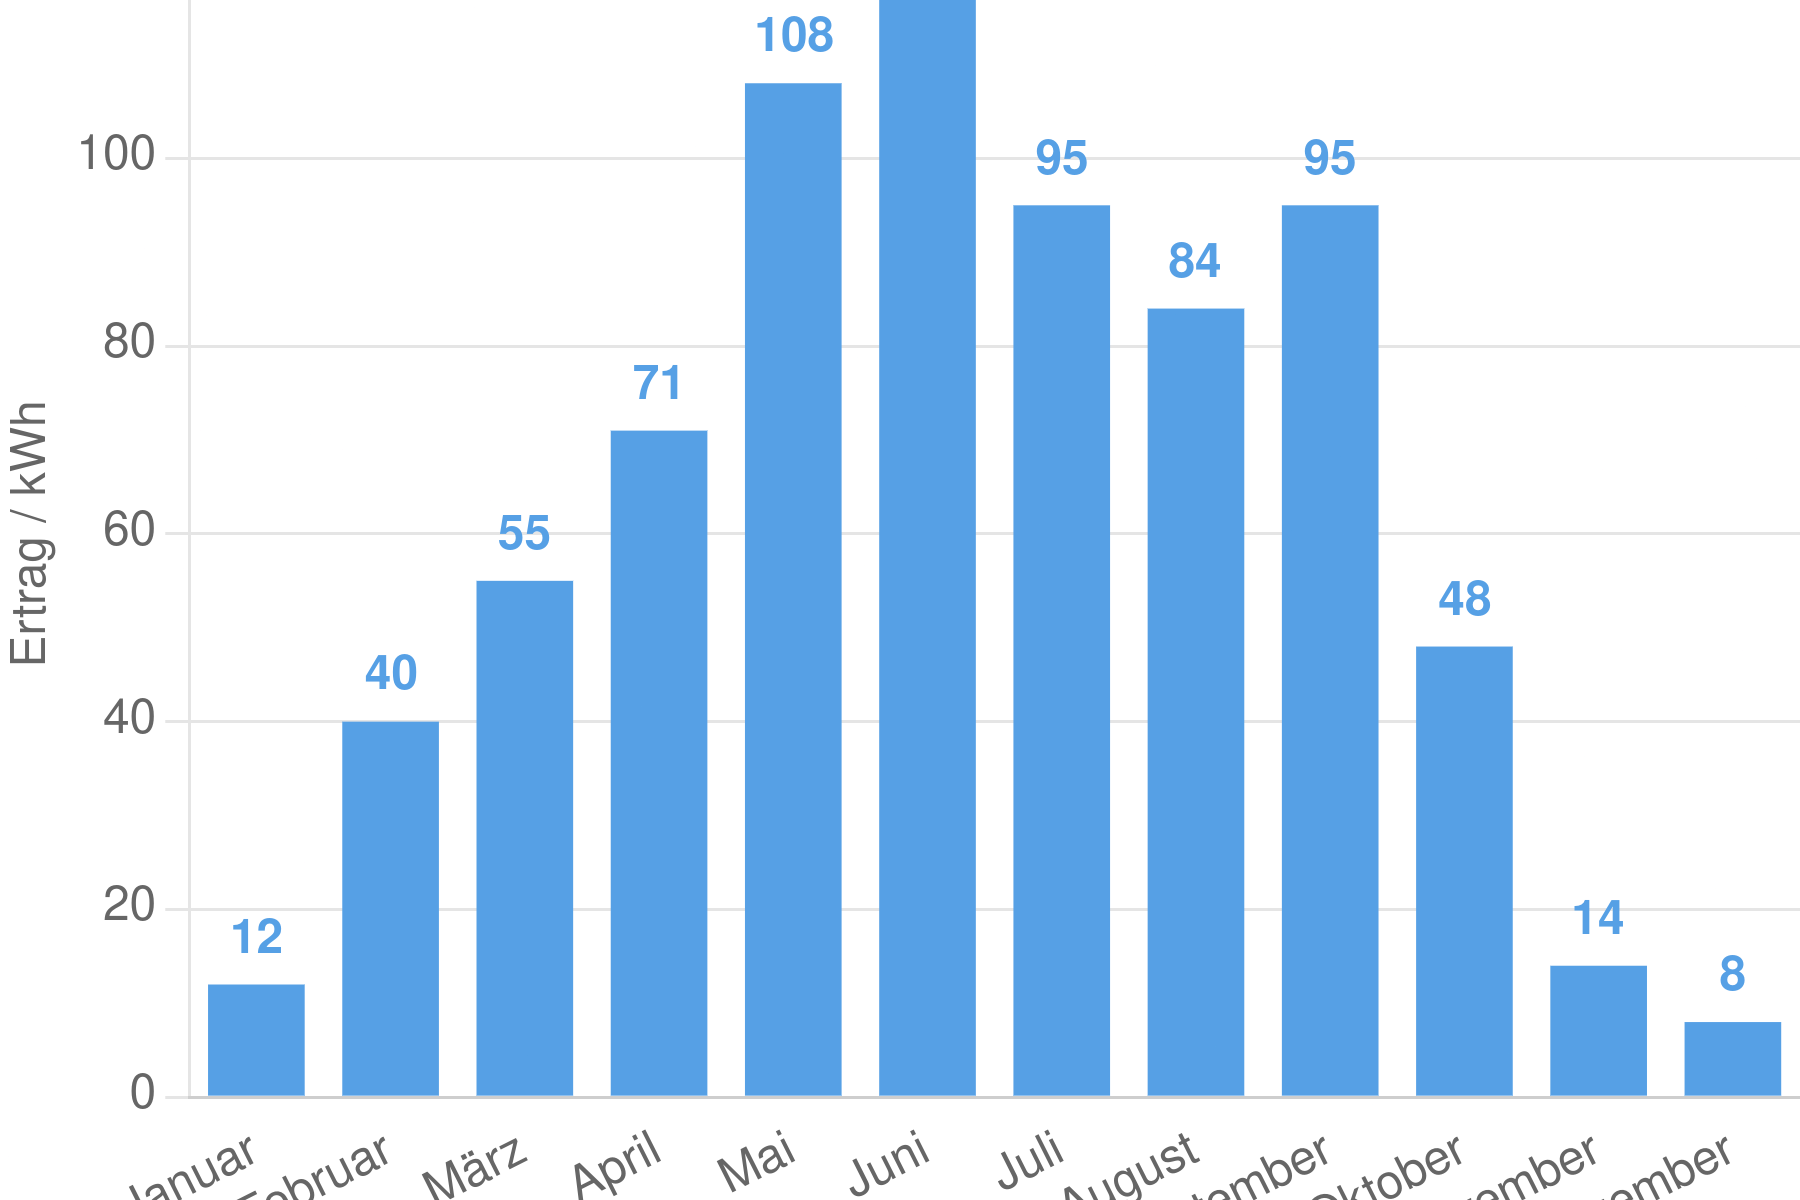

Column chart. Data table with 13 rows and 5 columns follows.
| 2023 | 2024 | 2025 | 2026 | |
|---|---|---|---|---|
| Januar | 12 | 21 | 20 | 13 |
| Februar | 40 | 32 | 36 | 22 |
| März | 55 | 57 | 88 | 80 |
| April | 71 | 75 | 95 | 105 |
| Mai | 108 | 89 | 108 | 102 |
| Juni | 117 | 97 | 109 | 106 |
| Juli | 95 | 100 | 95 | 113 |
| August | 84 | 105 | 99 | 97 |
| September | 95 | 67 | 44 | 86 |
| Oktober | 48 | 39 | 35 | 49 |
| November | 14 | 14 | 20 | |
| Dezember | 8 | 8 | 13 |